Setting up WebSphere Properties for Temenos Transact and TAFJ
This section shows you the WebSphere properties that you need to set for Temenos Transact and TAFJ.
Setting up Multiple Servants (zOS)
Number of servants setup.
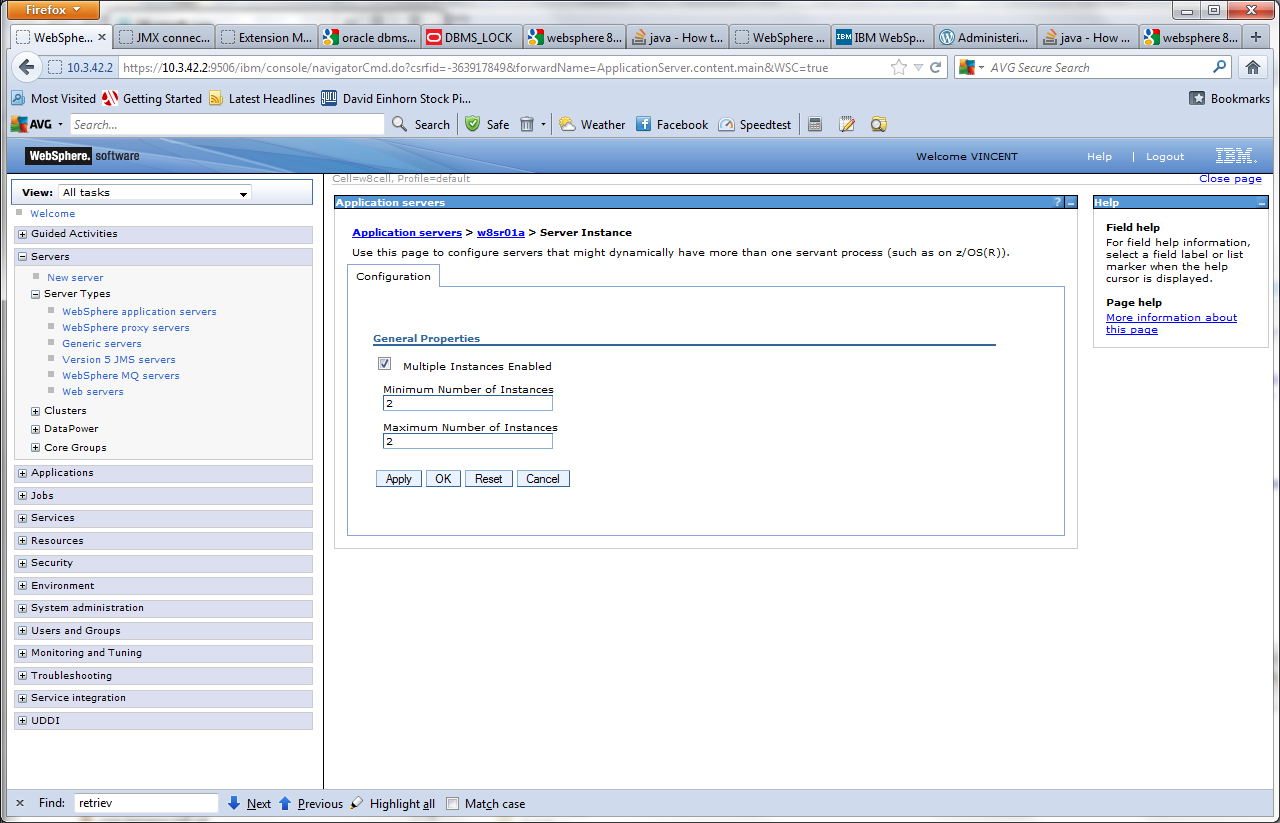
You need to set the property below so threads will go evenly to each servant for an IC.COB.
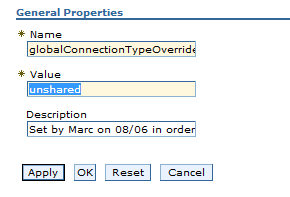
Set global transaction to unshared (Only needed for XA Driver) by following the path below.
Data sources > TAFJ XA DB2 Data source > Connection pools > Custom properties

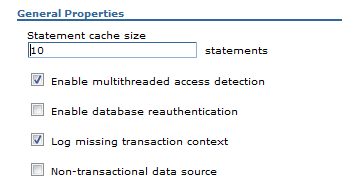
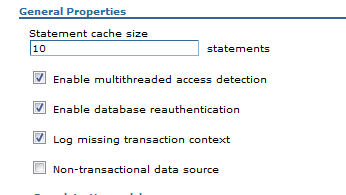
Setting up Data Source Mutithread for DB2 (Only needed for XA Driver)
Enable multithreaded access detection: Data sources > TAFJ XA DB2 Data source > WebSphere Application Server data source properties
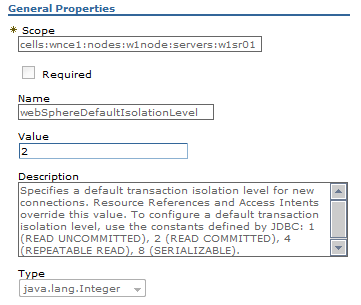
Setting up Data Source Isolation for DB2
Enable DB2 in READ_COMMITTED mode (no dirty reads): Data sources > TAFJ XA DB2 Data source > Custom properties (page 2)

Stopping Clean Thread of Appserv
Temenos Transact has SLEEPs in it. WebSphere detects this and stops the thread unless the following property is set.
Procedure
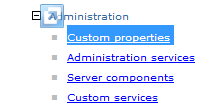
- Go to Application servers > w1sr01 > Administration > Custom properties.
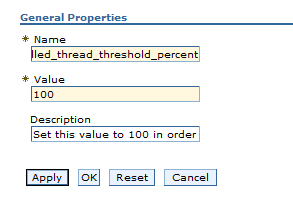
- Set server_region_stalled_thread_threshold_percent to 100 instead of 0.


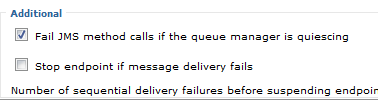
Removing End Point Delivery Message
Procedure
- Go to Activation specifications > Temenos Transact Execute Message MDB MQ > Advanced properties.
- Uncheck the Stop endpoint if message delivery fails check box.
Reconnecting Database Automatically (Only needed for XA Driver)
Procedure
- Go to Data sources > TAFJ XA DB2 Data source > WebSphere Application Server data source properties.
- Select the Enable database reauthentication check box.
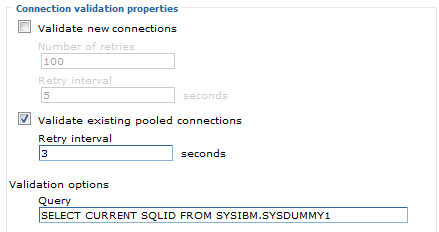
Validating Existing Pooled Connections (optional)
Setting up JInsight
This section is not recommended for production use as this is a profile tool.
Procedure
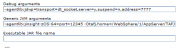
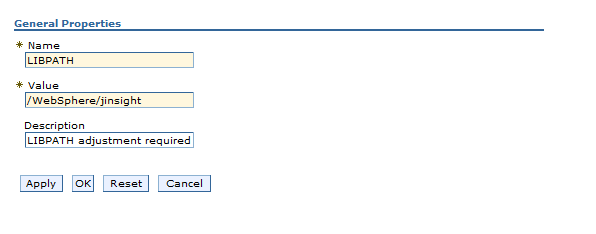
- Go to Application servers > w1sr01 > Process definition > Servant > Environment Entries and specify Name and Value as shown below.
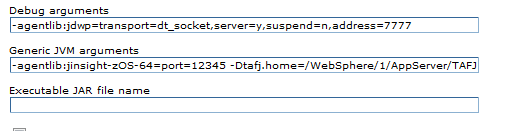
- Go to Application servers > w1sr01 > Process definition Servant > Java Virtual Machine and specify the JVM argument as -agentlib:jinsight-zOS-64=port=12345.
Setting up Support Assistant
This section is not recommended for production use as this is a profile tool.
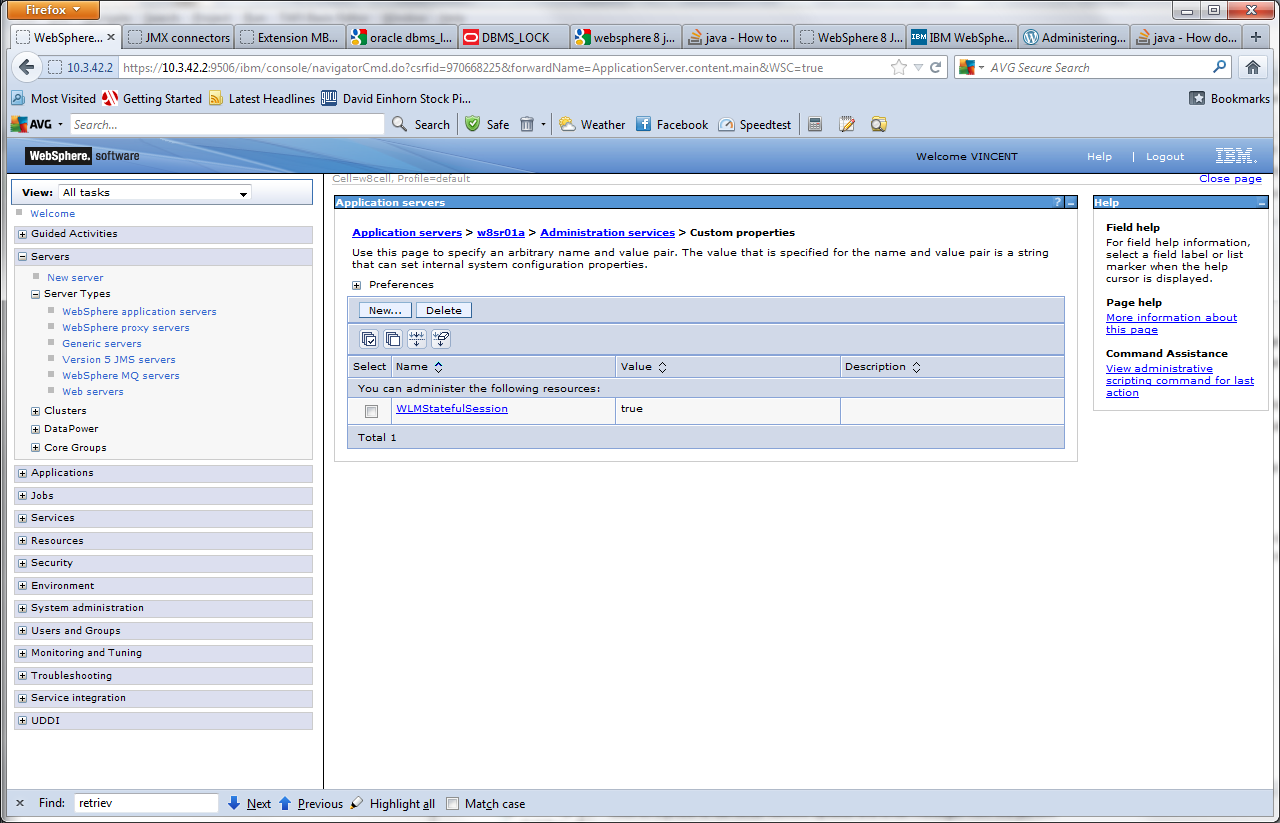
Setup load balance in queue with multiple servant by following the path below.
Application servers > w1sr01 > Custom properties
server_region_stalled_thread_threshold_percent = 100
server_work_distribution_algorithm = 1
server_use_wlm_to_queue_work = 0
Avoiding the Thread Cleaning of WebSphere and Disconnection of JDBC
If you get the error below, then use the following setting.
Error: com.ibm.websphere.ce.cm.ObjectClosedException: DSRA9110E: Statement is closed.
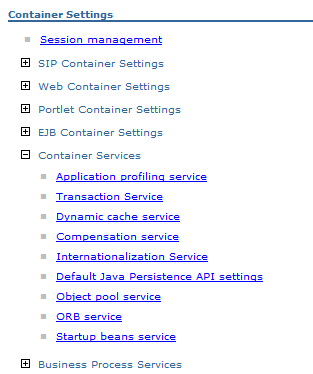
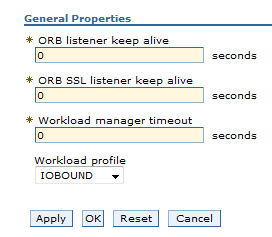
Application servers > tesr01a > ORB service > z/OS additional settings
Set Workload manager timeout to 0.
UAT and Production Memory Setting
For a UAT and production environment, you should refine your memory setting depending on your expected number of sessions and tSA. A session or tSA memory impact vary depending on the job done, it can be at least 20MB and up to 60MB.
For example, if you plan to run 80 interactive sessions and 40 tSA on a server, then you can estimate the max memory for sessions by applying:
120 sessions * average 50MB = 6G max heap size
You will have -Xmx6G
A good practice can be to set initial heap size to same value -Xms6G. If you are interested to monitor the sessions more precisely, then you can use a monitoring tool like Visual VM.
Take a heapdump when running the expected jobs, isolate the jSession objects and compute the retained size.
This is for one session.

This for 16 sessions.


You can also use TAFJ technical monitor to follow the memory evolution graph over the time and refine your setup.
 Memory Errors
Java heap space - Java.lang.OutOfMemoryError
Solution - Increase -Xmx max heap size parameter
PermGen space - Java.lang.OutOfMemoryError
Solution - Increase -XX:MaxPermSize max perm gen parameter
JVM Parameters
It is very common for a large application to face out of memory error which, in turn, results in the application crash. It is a very critical scenario and very hard to replicate to troubleshoot the issue. Therefore, JVM comes with some parameters which dump heap memory into a physical file which can be used later for finding out leaks:
-XX:+HeapDumpOnOutOfMemoryError
-XX:HeapDumpPath=./java_pid<pid>.hprof
-XX:OnOutOfMemoryError="< cmd args >;< cmd args >"
-XX:+UseGCOverheadLimit
Below are the parameter description used in the above setting:
- HeapDumpOnOutOfMemoryError instructs the JVM to dump heap into physical file in case of OutOfMemoryError.
- HeapDumpPath denotes the path where the file is to be written; any filename can be given; however, if JVM finds a <pid> tag in the name, the process ID of the current process causing the out of memory error will be appended to the file name with .hprof format.
- OnOutOfMemoryError is used to issue emergency commands to be executed in case of out of memory error. Proper command should be used in the space of cmd args. For example, if you want to restart the server as soon as out of memory occur, you can set the parameter:
- UseGCOverheadLimit is a policy that limits the proportion of the VM's time that is spent in GC before an OutOfMemory error is thrown.
-XX:OnOutOfMemoryError="shutdown -r"
Improving Performance for zOS
You need to perform the below steps for scalability with TAFJ (will scale to only around 67% CPU usage with 16-20 threads depending on what you are doing). The following parameters helps scale TAFJ much better on a WAS zOS implementation. Results might vary on other OS platforms.
Procedure
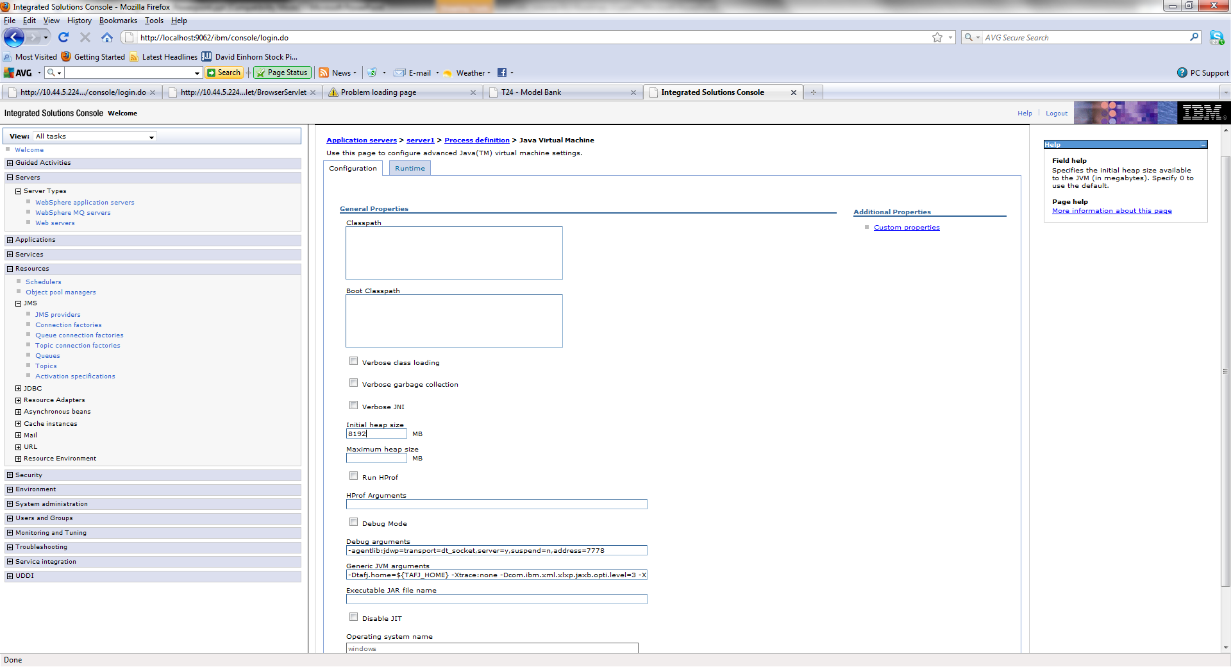
- Go to Application Servers> server1 > (under Java and Process Management ) > Process Definition > Java Virtual Machine.
- Change inital heap size to 8Gig.

- Set up Garbage Collection to gencon.
-Dtafj.home=${TAFJ_HOME} -Xtrace:none -Dcom.ibm.xml.xlxp.jaxb.opti.level=3 -Xgcpolicy:gencon –Xnoclassgc -Xlp1M
Setting up Cache Size
Set cache size high enough so number of prepares in DB2 decreases.
Stored Procedure Called for Duplicate Key
This needs to be done for the t24LockingDatasource! From doc TEMENOS T24z_Technical Report:
3.3.2 Sqlcode -803
During IC.COB, it was found that SQLCAMESSAGE stored procedure was called each time a duplicate key was inserted. This created increase in class 1 elapsed time. To resolve this, the retrieveMessagesFromServerOnGetMessage property in the WebSphere data source is set to false.
You need to go to Data sources > DB2 Universal JDBC Driver DataSource > Custom properties.
retrieveMessagesFromServerOnGetMessage=false
In this topic
